Workflow Trace
Menu map
Overview
Workflow trace is a powerful tool for debugging workflow issues. You create a trace definition to target a workflow with start and end dates during which the tracing will be active.
A trace definition is configured to operate at one of four levels of detail. Each time the workflow runs, the trace results are written as a new entry in the Trace History list. From the trace history list you can select a particular trace instance and drill down to view node and input/output details.
Workflow trace is not able to identify the event that triggered a workflow.
Trace definition management
Menu path: Workflow > Workflow Trace
To access theTrace Definition Management page, select Workflow > Workflow Trace on the portal main menu. This example has some trace definitions already configured: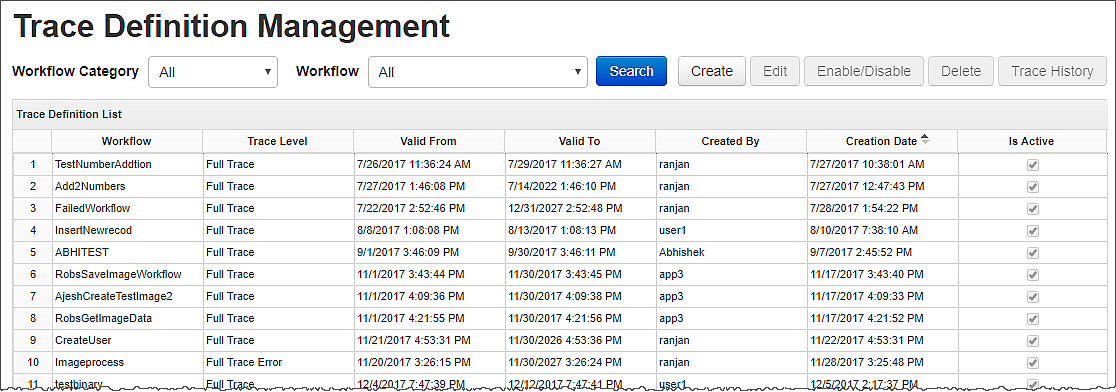
Filtering the list
At the top of the page, you can filter the list by Workflow Category, and then select a workflow or all workflows from within the chosen category in the Workflows drop-down list. Click Search to action the filter.
Creating a new trace definition
To create a new trace definition for a workflow:
- On the Trace Definition Management page, click Create.
- On the New Trace page, select the Workflow Category and Workflow from the drop-down lists.
- Select the Trace Level from the drop-down list choices: Information Trace, Full Trace, Full Trace Error, Error Trace.
- Select the Valid From and Valid To dates using the date pickers.
- To make this trace definition active (within the active date range configured) select the Is Active tick box . If Is Active is not selected, the trace definition will be disabled at all times, irrespective of the date range.
- Click Save.
Editing a trace definition
To edit a trace definition:
- On the Trace Definition Management page, select the trace definition and click Edit.
- On the Trace Edit page, make the required changes and then click Save.
Deleting a trace definition
To delete a trace definition:
- On the Trace Definition Management page, select the trace definition and click Delete.
- On the Delete Workflow Trace Definition pop-up, click Continue.
Enabling or disabling a trace definition
This setting is reflected in the Is Active flag.
To enable or disable a trace definition:
- On the Trace Definition Management page, select the trace definition and click Enable or Disable (depending on the current state of the trace definition).
- On the pop-up, click Continue.
Trace history
Menu path: Trace Definition Management > Trace History
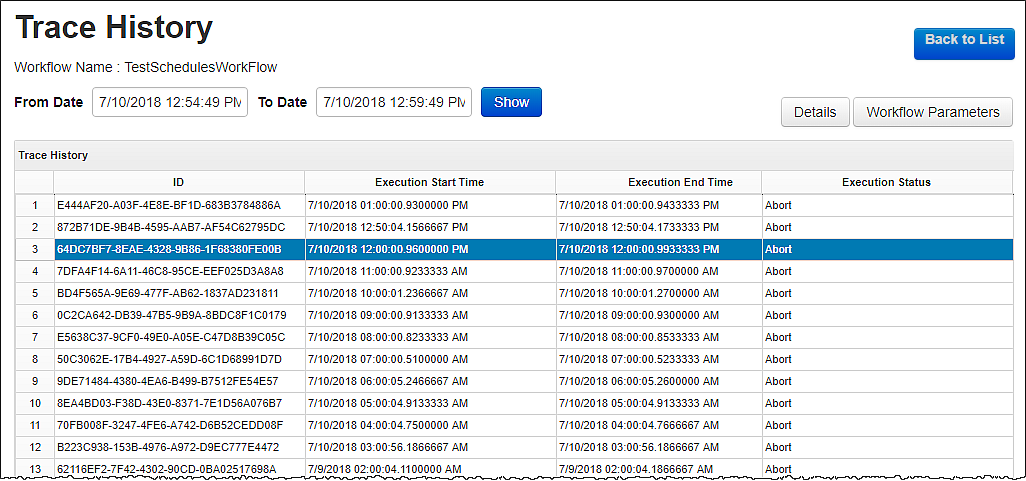
Trace results are listed in the Trace History page. To view trace results for a trace definition, select it from the list on the Trace Definition Management page, and click Trace History, or double-click it in the list.
Example
Filtering the list
At the top of the Trace History page, you can filter the list by date range by setting the From Date and To Date date pickers followed by the Show button.
Details
Menu path: Trace Definition Management > Trace History > Details
To examine the workflow details:
On the Trace History page, select the trace history event and click Details.
The page displays Trace Node Details in the upper half of the page, and Workflow Abort Details in the lower half.
Trace node details
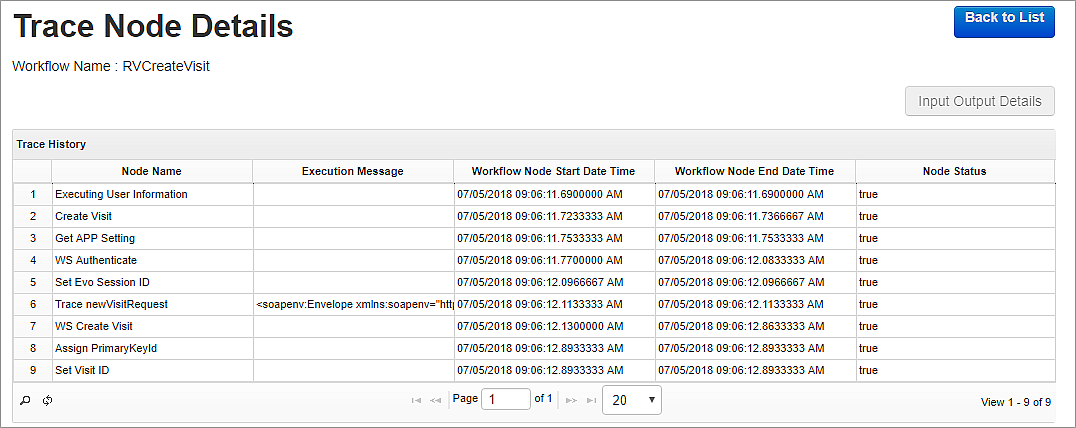
The Trace Node Details list shows the following details for each node in the workflow;
- execution messages, if any.
- start and finish times for the node processing.
- node status—true or false, indicating whether the node processing executed successfully or not.
Example
This example is from a workflow comprising nine nodes.
To aid fault-finding or development, you can add one or more TraceNode nodes into a workflow sequence. A TraceNode adds useful information to the trace, for example, using a TraceNode you can specify:
- a variable whose value will be reported in the trace at the point of the TraceNode.
- a literal string—for example, "at this point the workflow is about to access the data object..."
- a VB expression.
Input output details
Menu path: Trace Definition Management > Trace History > Details > Input Output Details
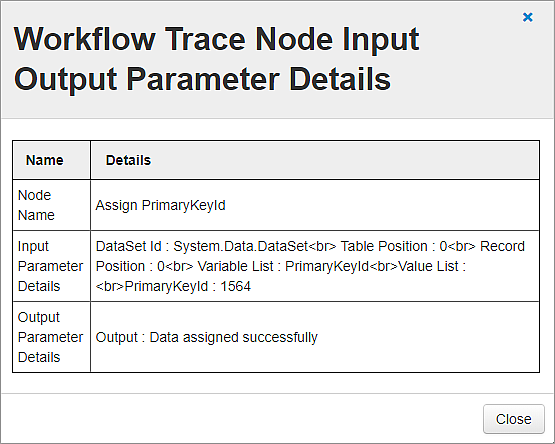
On the Trace Node Details page, you can examine the input and output details for a node in the list.
Select the node and click the Input Output Details button. The details are shown in a pop-up.
Example
Workflow parameters
Menu path: Trace Definition Management > Trace History > Workflow Parameters
Note | This trace feature operates on a workflow but does not show node details. For node-level details see Workflow Trace below.
To examine the overall workflow input and output parameters:
On the Trace History page, select the trace history event and click Workflow Parameters.
Example
The workflow in this simple example takes two numbers as inputs and adds them together to provide the output:

Workflow abort details
Menu path: Trace Definition Management > Trace History > Details
This trace feature provides node-level details if the workflow aborted. It appears in the lower half of the Details page.
Example

